Gun Violence Heatmap features
Find insights in the data with a range of animated and interactive tools
Expand
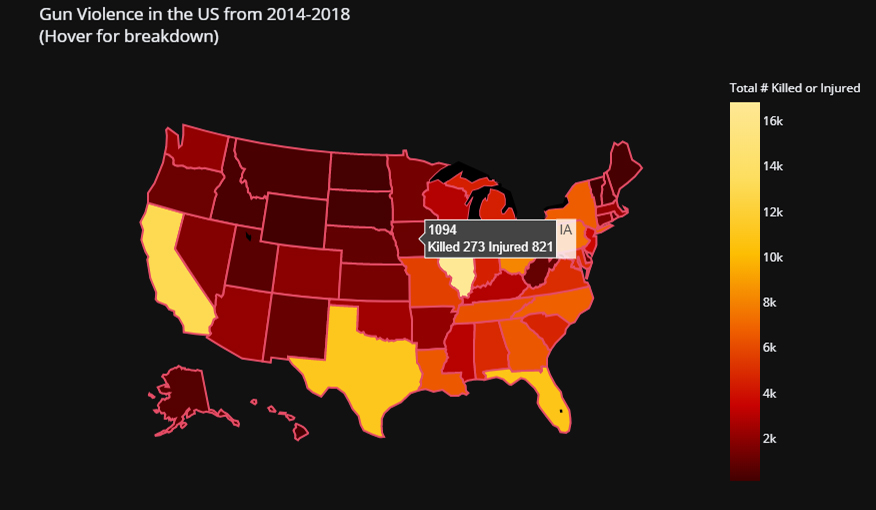
Explore variation in statistics between states with the national data tool.
National Gun Violence Data
All of the statistics for comparing gun violence rates across states presented visually.
Expand
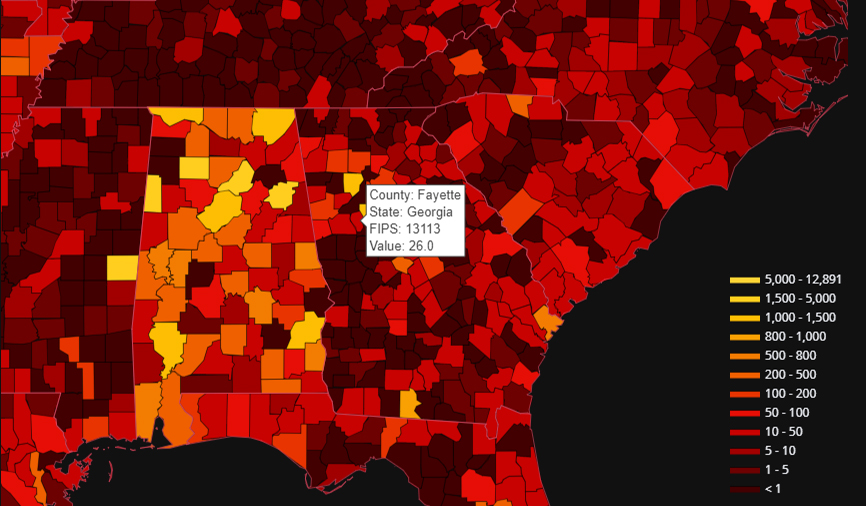
Identify differences between counties with the county data tool.
County Data Tool
All of the statistics for comparing gun violence rates across counties presented visually.
Expand
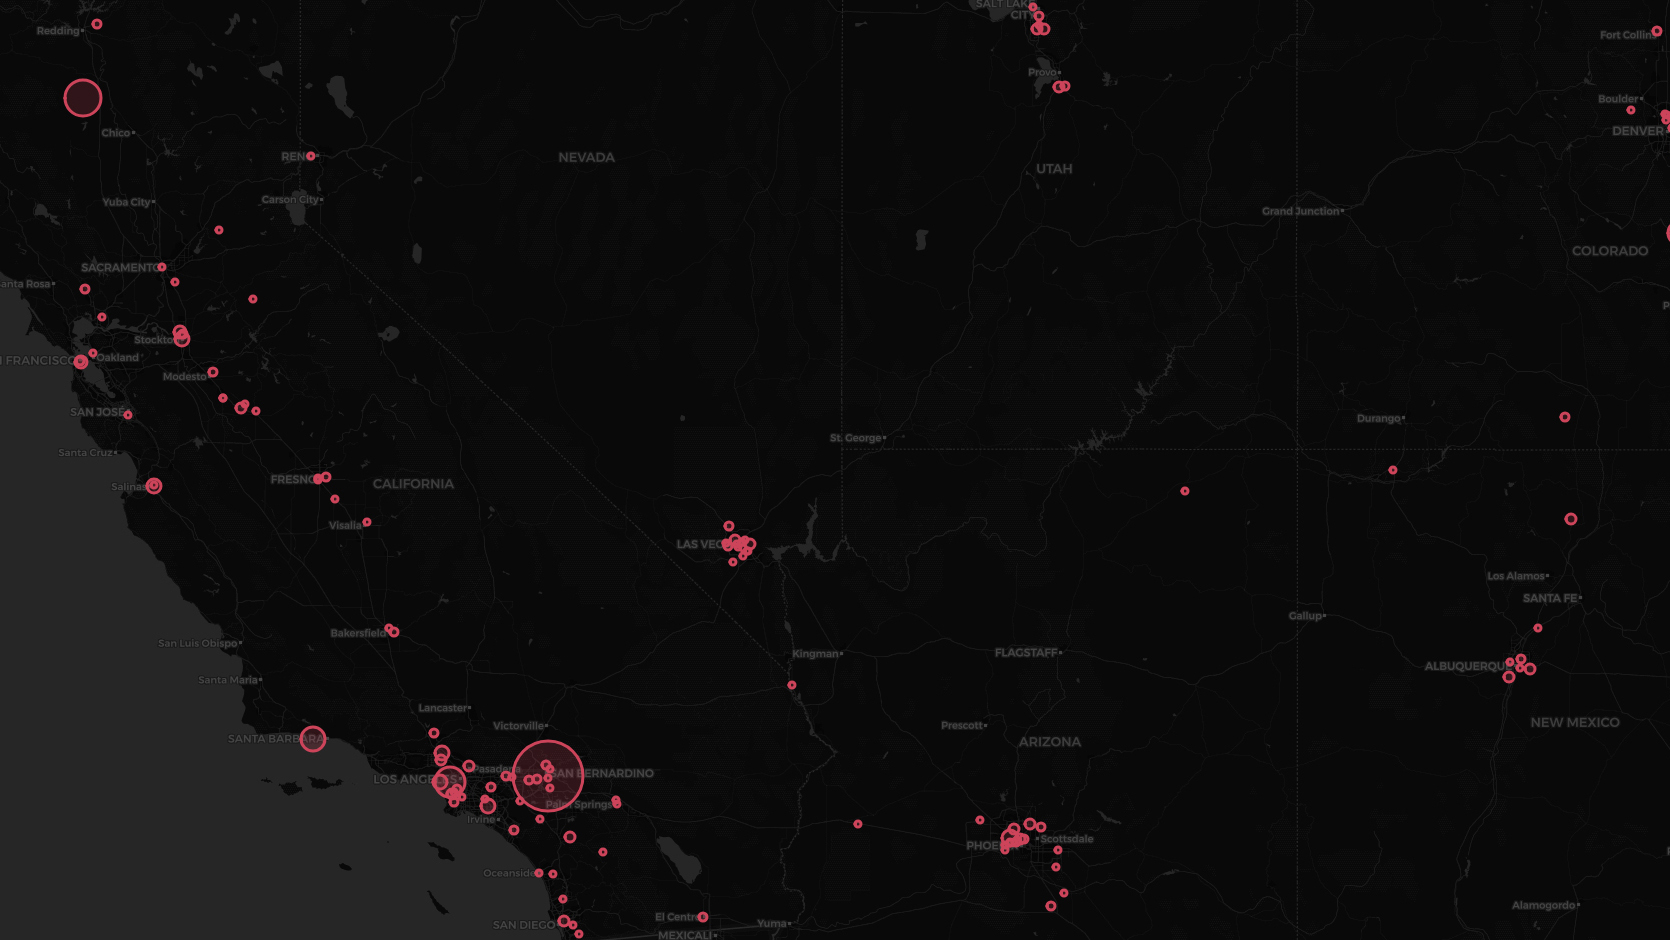
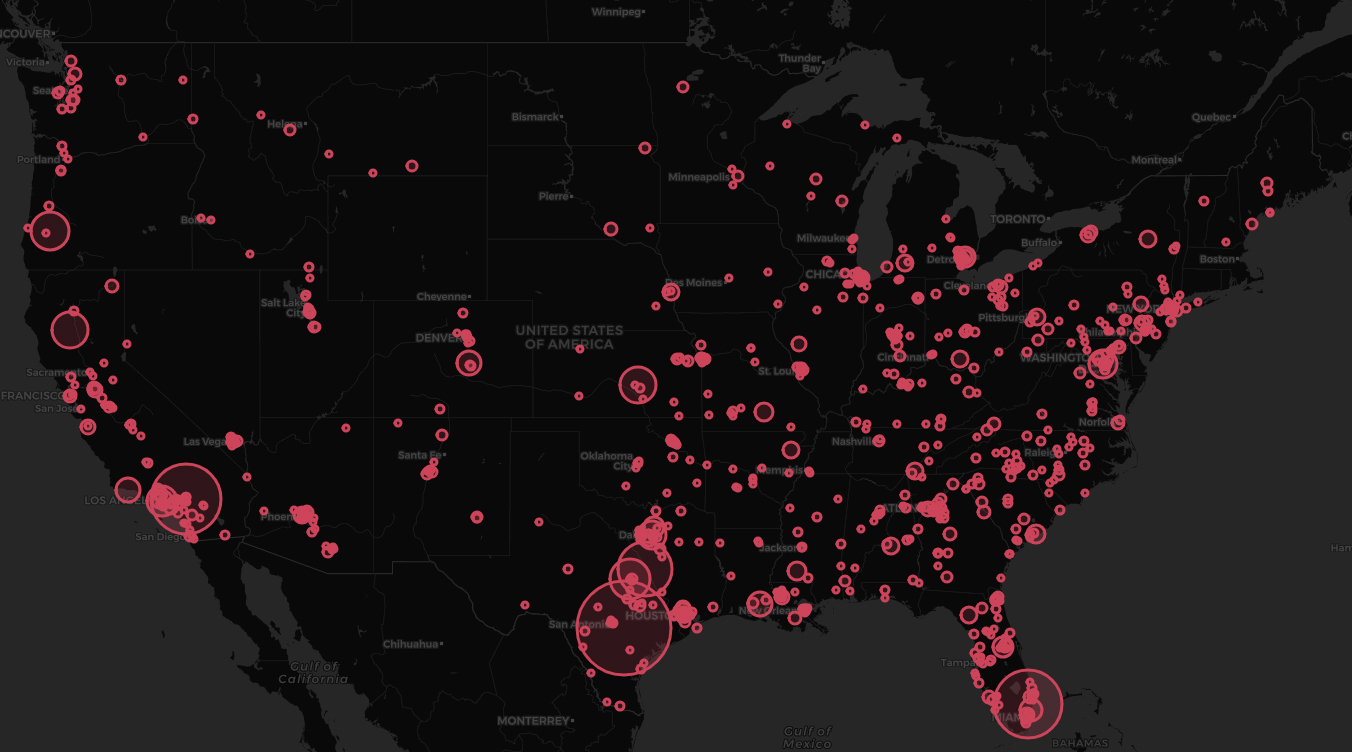
Compare individual shootings interactively with the shooting size tool.
Individual Shooting Severity Tool
The size of circles on the map corresponds to the size of the shooting that occurred there.
Expand
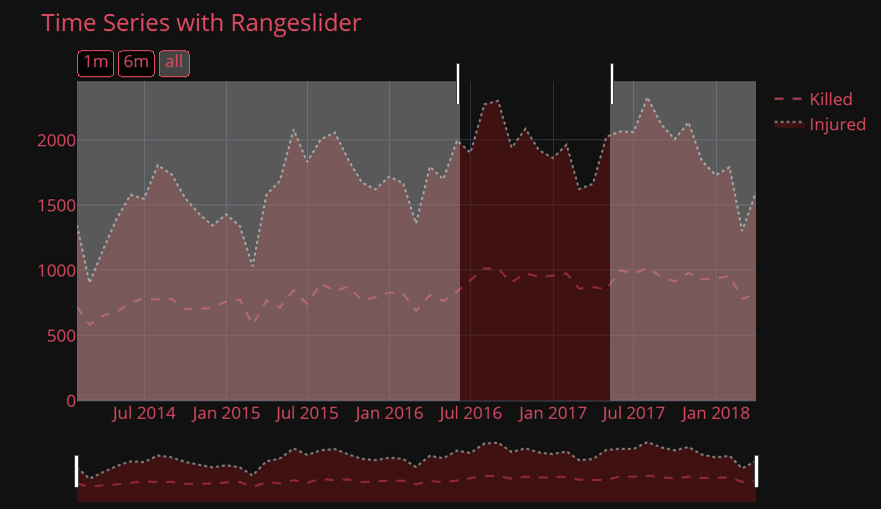
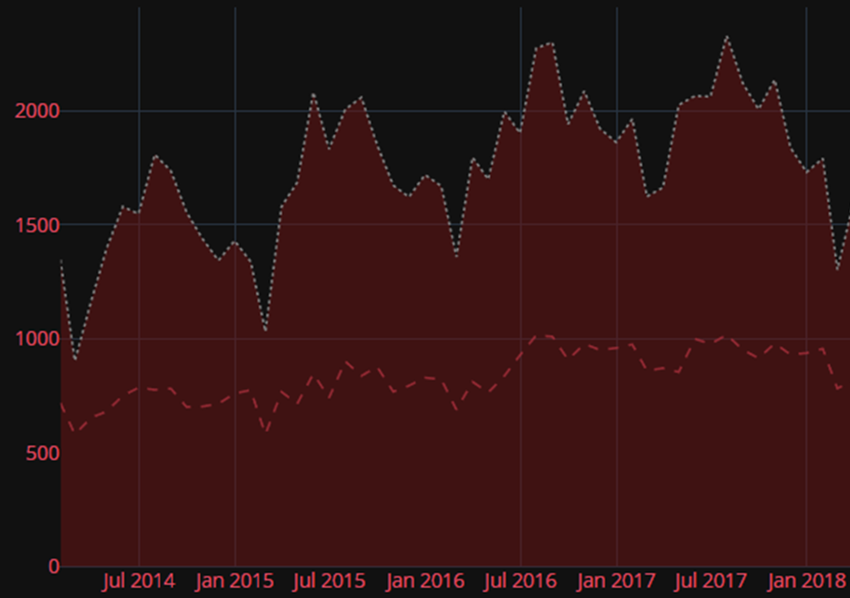
Choose the timeframe for you analysis with the time series data tool.
Time Series Data Tool
Zoom in on precisely the data you need for your analysis.
Expand
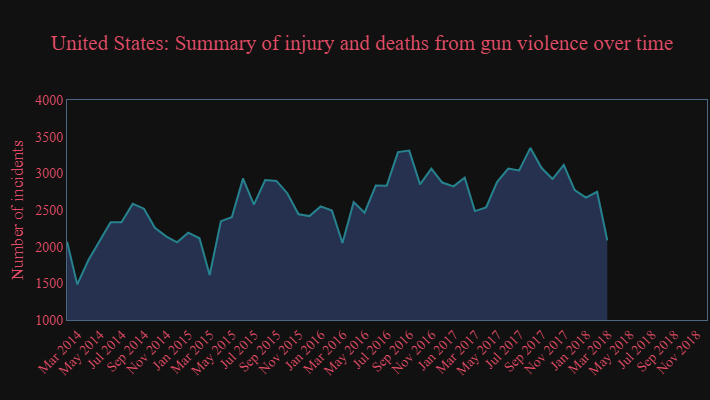
Watch violence trends develop over time with the trends tool.
Trends Tool
These animated charts show statistical trends developing across time.
Expand
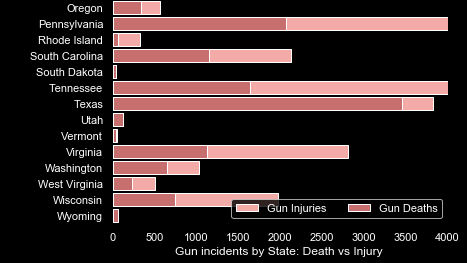
Dig into specific gun violence metrics with the charts tool.
Charts Tool
Visually explore gun violence data from a variety of stastical angles.